
What Is AQ Analytics?
Analytics is a reporting tool in AQ that aggregates your data and allows you to visualize your quoting activity. You can filter your results by date, manufacturer, salesperson or customer to identify trends related to your quoting.
How Do I Access Analytics?
You will see the Analytics tab at the bottom of the AQ window when you open AQ.
.png?width=95&height=23&name=AQ_Analytics_Tab(1).png)
If you are a licensed AQ user and you do not see Analytics, contact our AutoQuotes administrator to request your access.
Why Don’t I See Any Data in Analytics?
AQ Analytics pulls data directly from your AQ projects. Data will appear only if there are projects associated with your account.
If you have projects and your data is not available, please contact AutoQuotes Support to resolve the issue.
Can Anyone Else See My Data?
Only account administrators can see company-wide Analytics data. AQ users will be able to see the data associated with their own projects.
How Can I Use Analytics?
AQ Analytics allows you to drill-down within the available categories by clicking on the filter icons within the various tables displayed on the screen.

For example, to create a report showing a manufacturer markup charged to a particular customer, click on the filter icon in the row listing the manufacturer of interest, then select icon in the row that contains the customer of interest.
How Can I Change My View?
You can change the tables displayed in AQ Analytics by clicking on the Edit Layout button located on the ribbon at the top of the screen.

In the dialog, uncheck tables and graphs to remove them and/or select a table and click the up or down buttons to change the order in which it is displayed.
How Do I See Data for Projects That I Won?
You can assign statuses like “won,” “lost” or “in progress” to a project from the Settings section of the Projects Details panel. Our AQ Administrator can control what statuses appear in the drop-down menu.

By assigning statuses to your projects, you can filter by those statuses in AQ Analytics.

How Do I See Data for Marketing Categories?
You can assign marketing categories like “Full Service Restaurant” or “College, University” to a project from the Settings section of the Projects Details panel. The AQ Administrator can control what marketing categories appear in the drop-down menu.
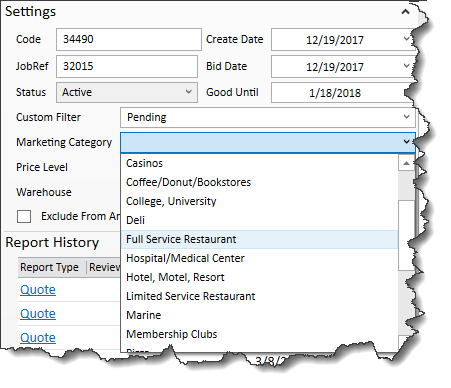
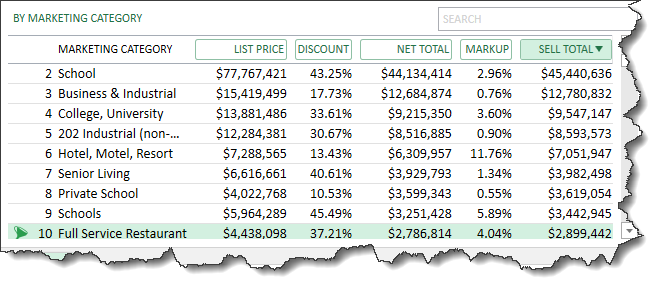
By assigning marketing categories to your project, you can filter by those marketing categories in AQ Analytics.
How Do I Export My Data?
To export the data displayed on your screen, click the Excel export button located on the ribbon at the top of screen and save the file to your computer or other device.
